Immunohistochemistry is an essential tool that helps pathologists find the correct diagnosis of a specimen. It is based on antigen-antibody specificity binding and also looks really cool.
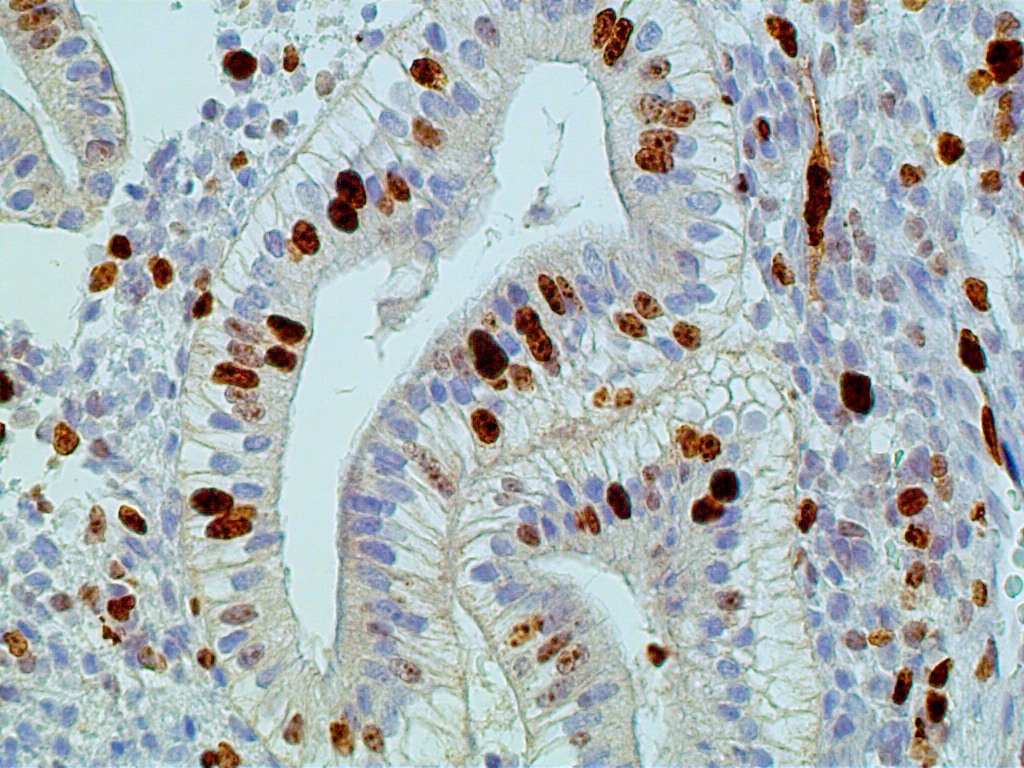 Proliferative endometrium. Picture from pathologyoutlines.com.
You can read more about it here for example.
I was re-reading Molavi's excelent book and thought "this would make a nice table". The nice table turned into some nice charts, that I wanted to share here.
The first one is a Sankey Diagram, created with Google Charts. It shows the relations between tumors, markers, and patterns. The weight is based on my subjective experience. Of course, it does not cover all possibilities but it gives a good overview, in my opinion.
Try again
Then I wanted to create a cool net graph. But I have to admit D3.js is not my favorite data viz tool.
If at first you don't succeed, dust yourself off, and try again.
(Aaliyah)
Luckily, I discovered Google's Fusion Tables (let's hope they do not terminate the project).
I hope you enjoy it! Do not hesitate to contact me if you have any suggestions or corrections.